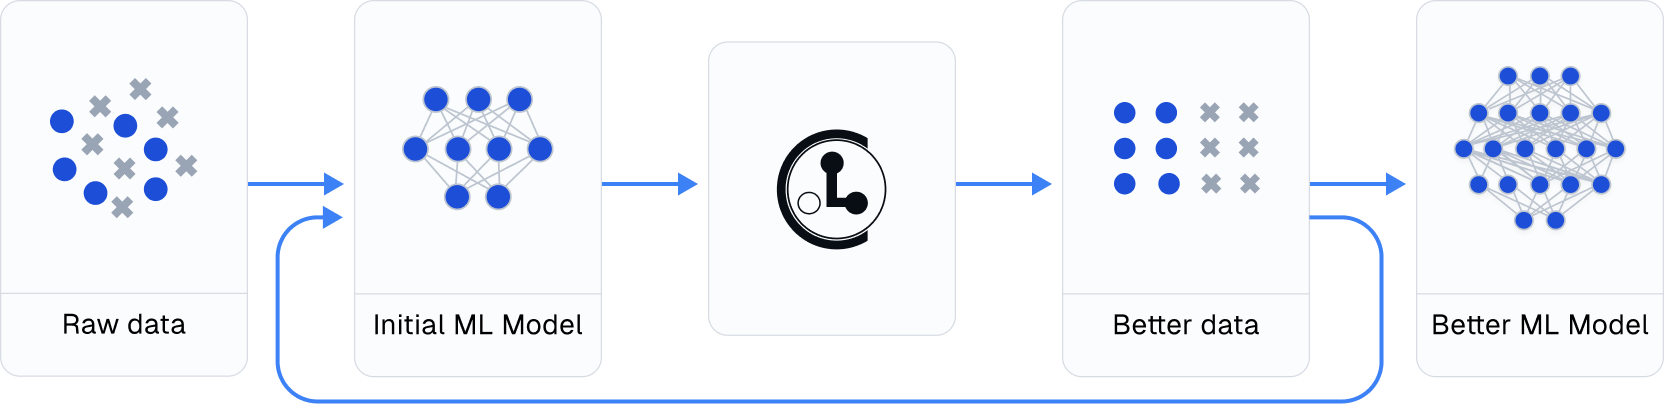
1. 数据质量管理——CleanLab
- GitHub: https://github.com/cleanlab/cleanlab
- 功能: 自动检测和清理数据集中的问题
- 特点: 特别适合机器学习数据集的标签和数据质量检查
- 优势: 自动化程度高,可以节省大量手动检查数据的时间
- 安装:
pip install cleanlab - 代码示例: ```python from cleanlab.classification import CleanLearning from sklearn.linear_model import LogisticRegression
初始化清洗器
cl = CleanLearning(clf=LogisticRegression())
训练并识别问题数据
cl.fit(X_train, y_train)
查找标签问题
issues = cl.find_label_issues()
高级用法
获取置信度矩阵
confident_joint = cl.confident_joint
获取噪声标签的概率
label_quality_scores = cl.get_label_quality_scores()
1
2
3
4
5
6
7
8
9
10
11
12
13
14
15
16
17
18
19
20
21
22
23
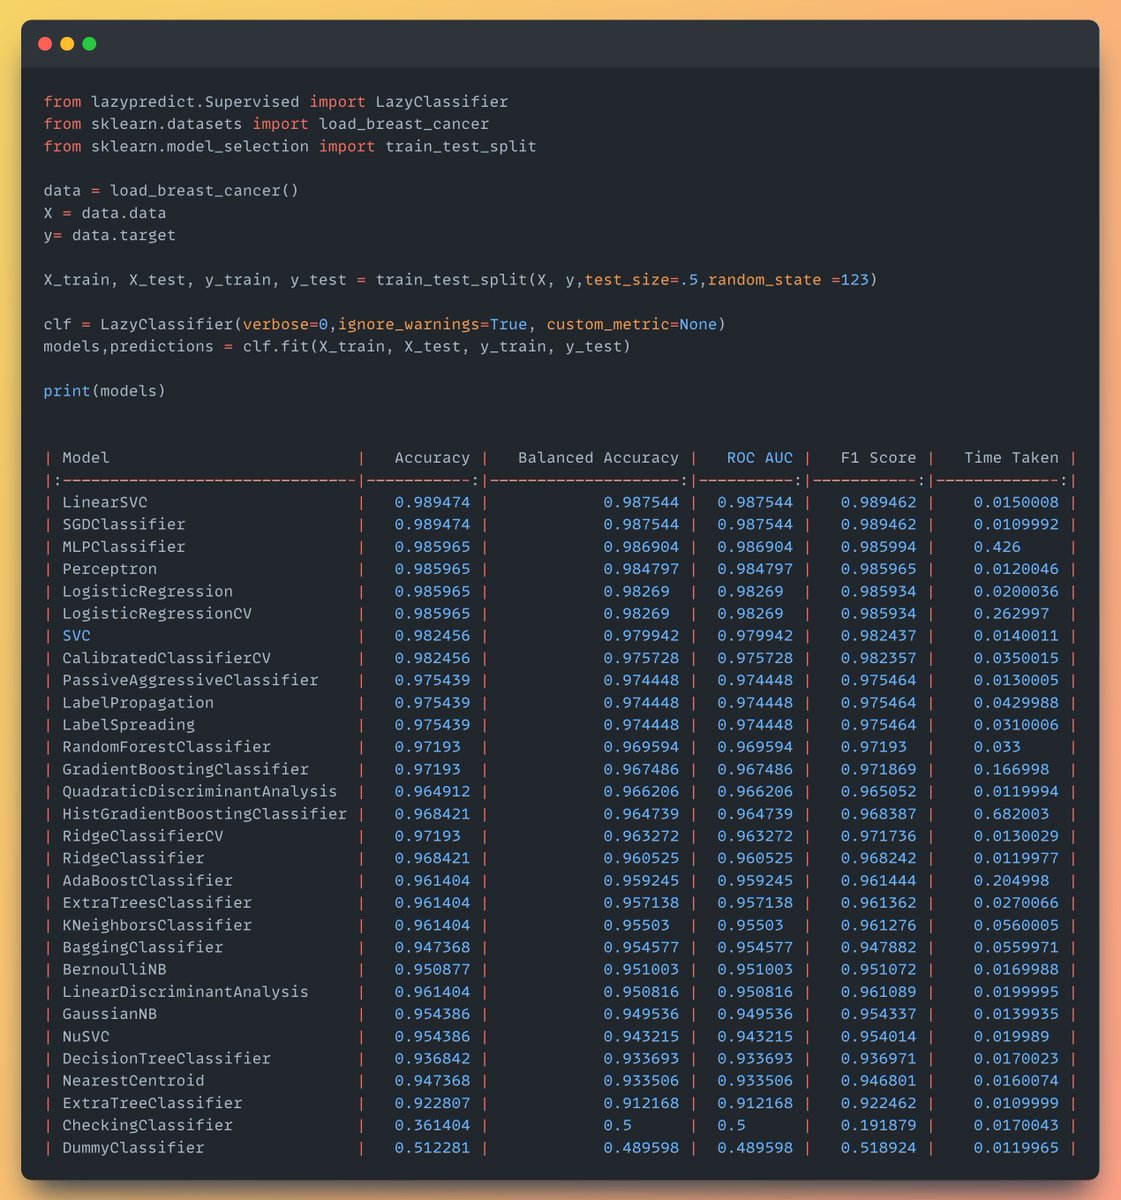
## 2. 快速模型评估—— LazyPredict
- **PyPI**: https://pypi.org/project/lazypredict/
- **功能**: 同时训练和评估多个机器学习模型
- **特点**: 支持回归和分类任务
- **优势**: 只需几行代码就能比较多个模型的性能
- **安装**: `pip install lazypredict
- **代码示例**:`
```python
from lazypredict.Supervised import LazyRegressor, LazyClassifier
# 回归任务
reg = LazyRegressor(verbose=0, ignore_warnings=True)
models_train, predictions_train = reg.fit(X_train, X_test, y_train, y_test)
# 分类任务
clf = LazyClassifier(verbose=0, ignore_warnings=True)
models_train, predictions_train = clf.fit(X_train, X_test, y_train, y_test)
# 查看模型性能比较
print(models_train)
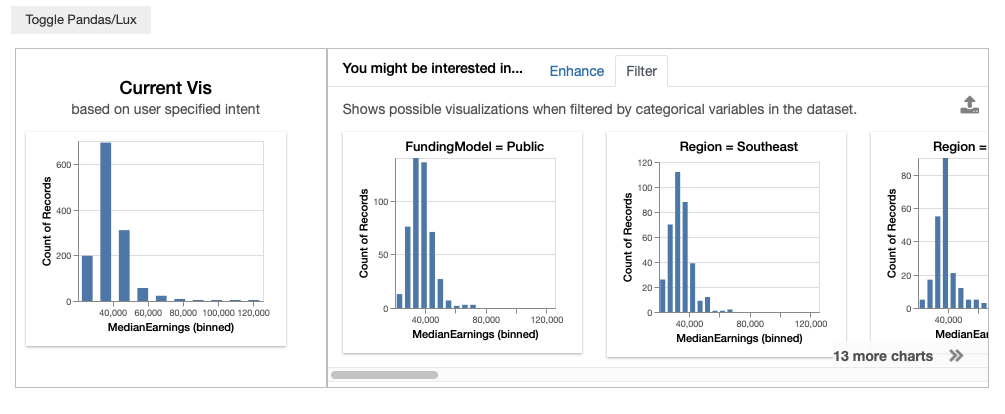
3. 智能数据可视化——Lux
- GitHub: https://github.com/lux-org/lux
- 功能: 快速数据可视化和分析
- 特点: 提供简单高效的数据探索方式
- 优势: 自动推荐合适的可视化方式
- 安装:
pip install lux-api - 代码示例: ```python import lux import pandas as pd
基础使用
df = pd.read_csv(“dataset.csv”) df.visualize() # 自动生成可视化建议
高级用法
指定感兴趣的变量
df.intent = [“column_A”, “column_B”]
设置可视化偏好
df.set_intent_as_vis([“Correlation”, “Distribution”])
1
2
3
4
5
6
7
8
9
10
11
12
13
14
15
16
17
18
19
## 4. 智能导入工具——PyForest
- **PyPI**: https://pypi.org/project/pyforest/
- **功能**: 一键导入数据科学相关的库
- **特点**: 节省编写导入语句的时间
- **优势**: 包含了常用的数据科学库
- **安装**: `pip install pyforest`
- **代码示例**:
```python
from pyforest import *
# 使用时自动导入
df = pd.read_csv("data.csv") # pandas自动导入
plt.plot([1, 2, 3]) # matplotlib自动导入
# 查看已导入的模块
active_imports()
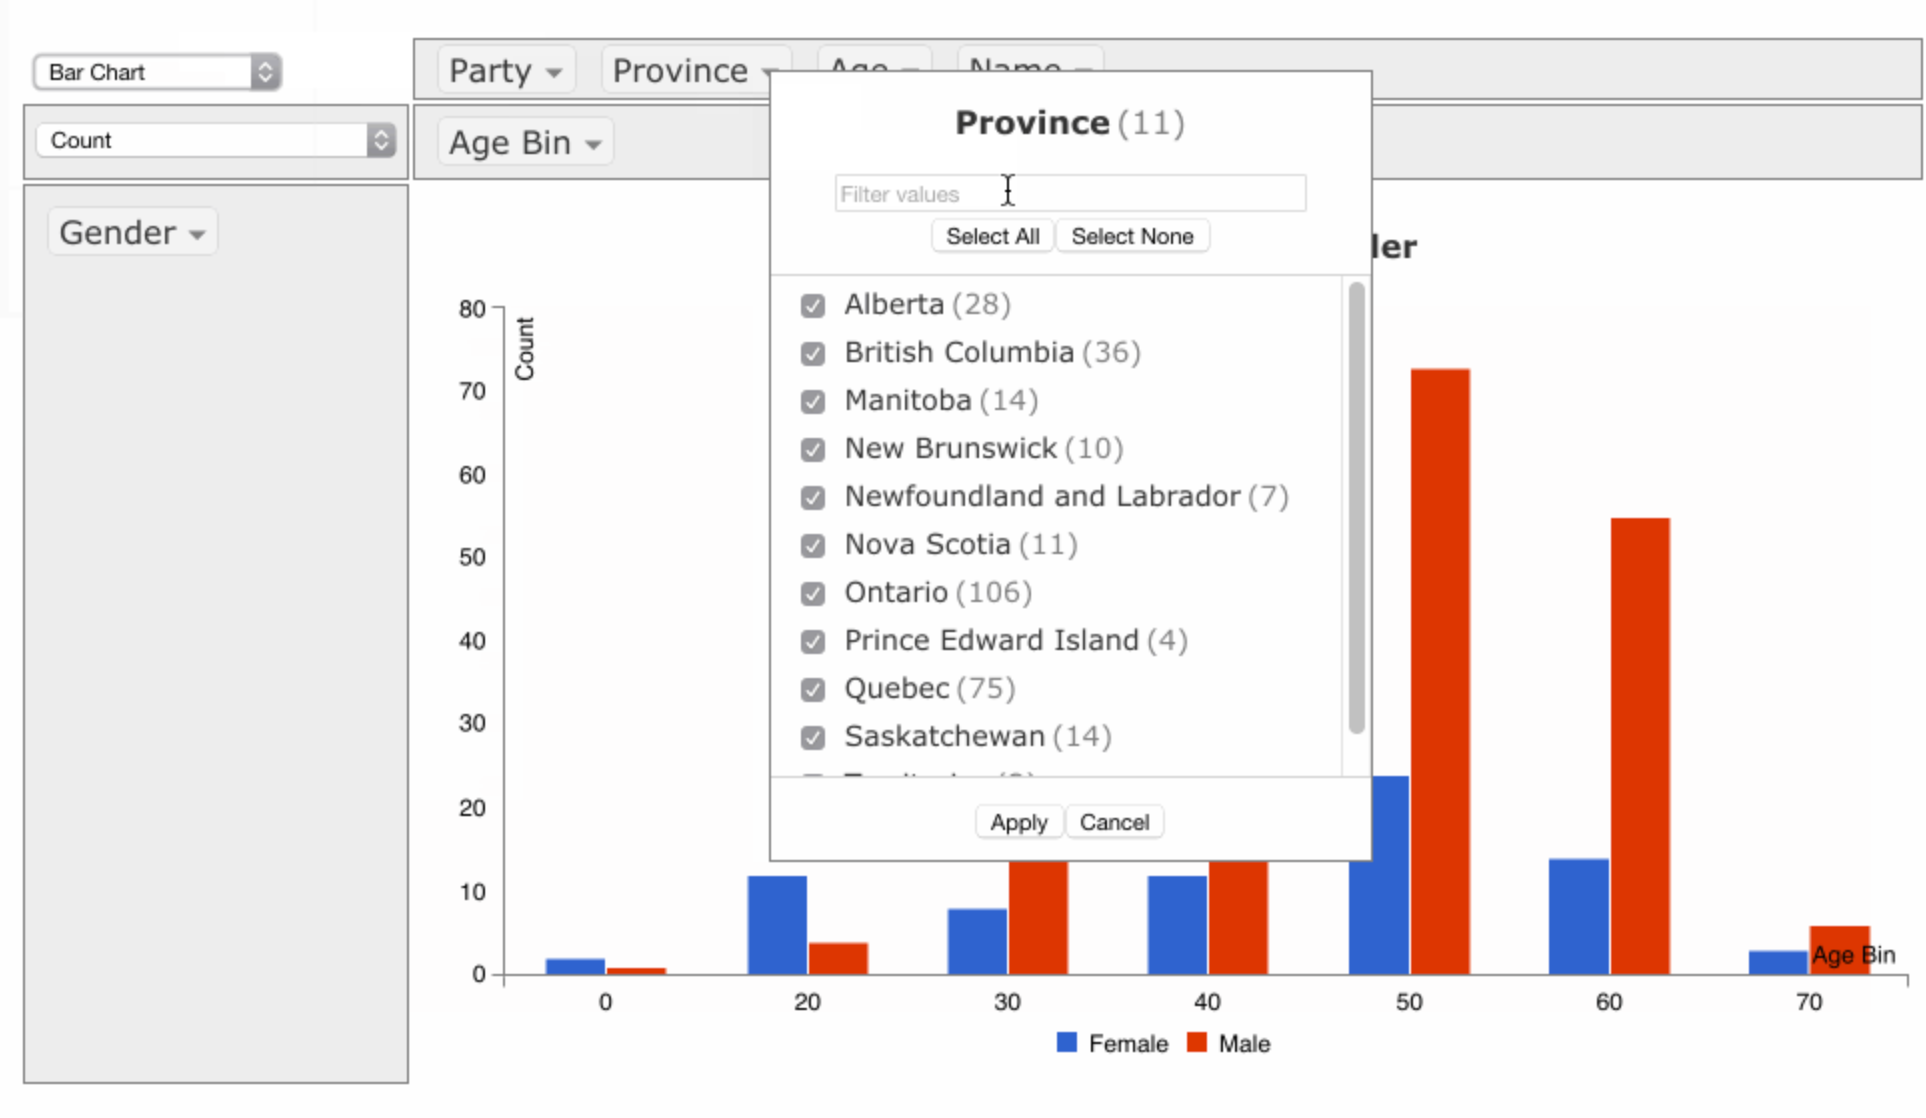
5. 交互式数据分析——PivotTableJS
- PyPI: https://pypi.org/project/pivottablejs/
- 官网:https://pivottable.js.org/examples/
- 功能: 在Jupyter Notebook中交互式分析数据
- 特点: 无需编写代码即可进行数据透视分析
- 优势: 适合非技术人员使用
- 安装:
pip install pivottablejs - 代码示例: ```python from pivottablejs import pivot_ui
创建交互式数据透视表
pivot_ui(df)
自定义配置
pivot_ui(df, rows=[‘category’], cols=[‘year’], aggregatorName=’Sum’, vals=[‘value’])
1
2
3
4
5
6
7
8
9
10
11
12
13
14
15
16
17
18
19
20
## 6. 教学可视化工具——Drawdata
- **PyPI**: https://pypi.org/project/drawdata/
- **功能**: 在Jupyter Notebook中绘制2D数据集
- **特点**: 可视化学习机器学习算法的行为
- **优势**: 特别适合教学和理解算法原理
- **安装**: `pip install drawdata`
- **代码示例**:
```python
import drawdata
import pandas as pd
# 创建交互式绘图界面
df = drawdata.get_data()
# 导出绘制的数据
df.to_csv('drawn_data.csv')
7. 代码质量工具——Black
- PyPI: https://pypi.org/project/black/
- 功能: Python代码格式化工具
- 特点: 统一的代码格式规范
- 优势: 提高代码可读性,被广泛使用
- 安装:
pip install black - 代码示例:
```python
命令行使用
black your_script.py
或在Python中使用
import black
格式化代码字符串
formatted_code = black.format_str(source_code, mode=black.FileMode())
格式化整个项目
black .
检查模式(不实际修改文件)
black –check .
1
2
3
4
5
6
7
8
9
10
11
12
13
14
15
16
17
18
19
20
21
22
23
24
25
26
27
28
29
30
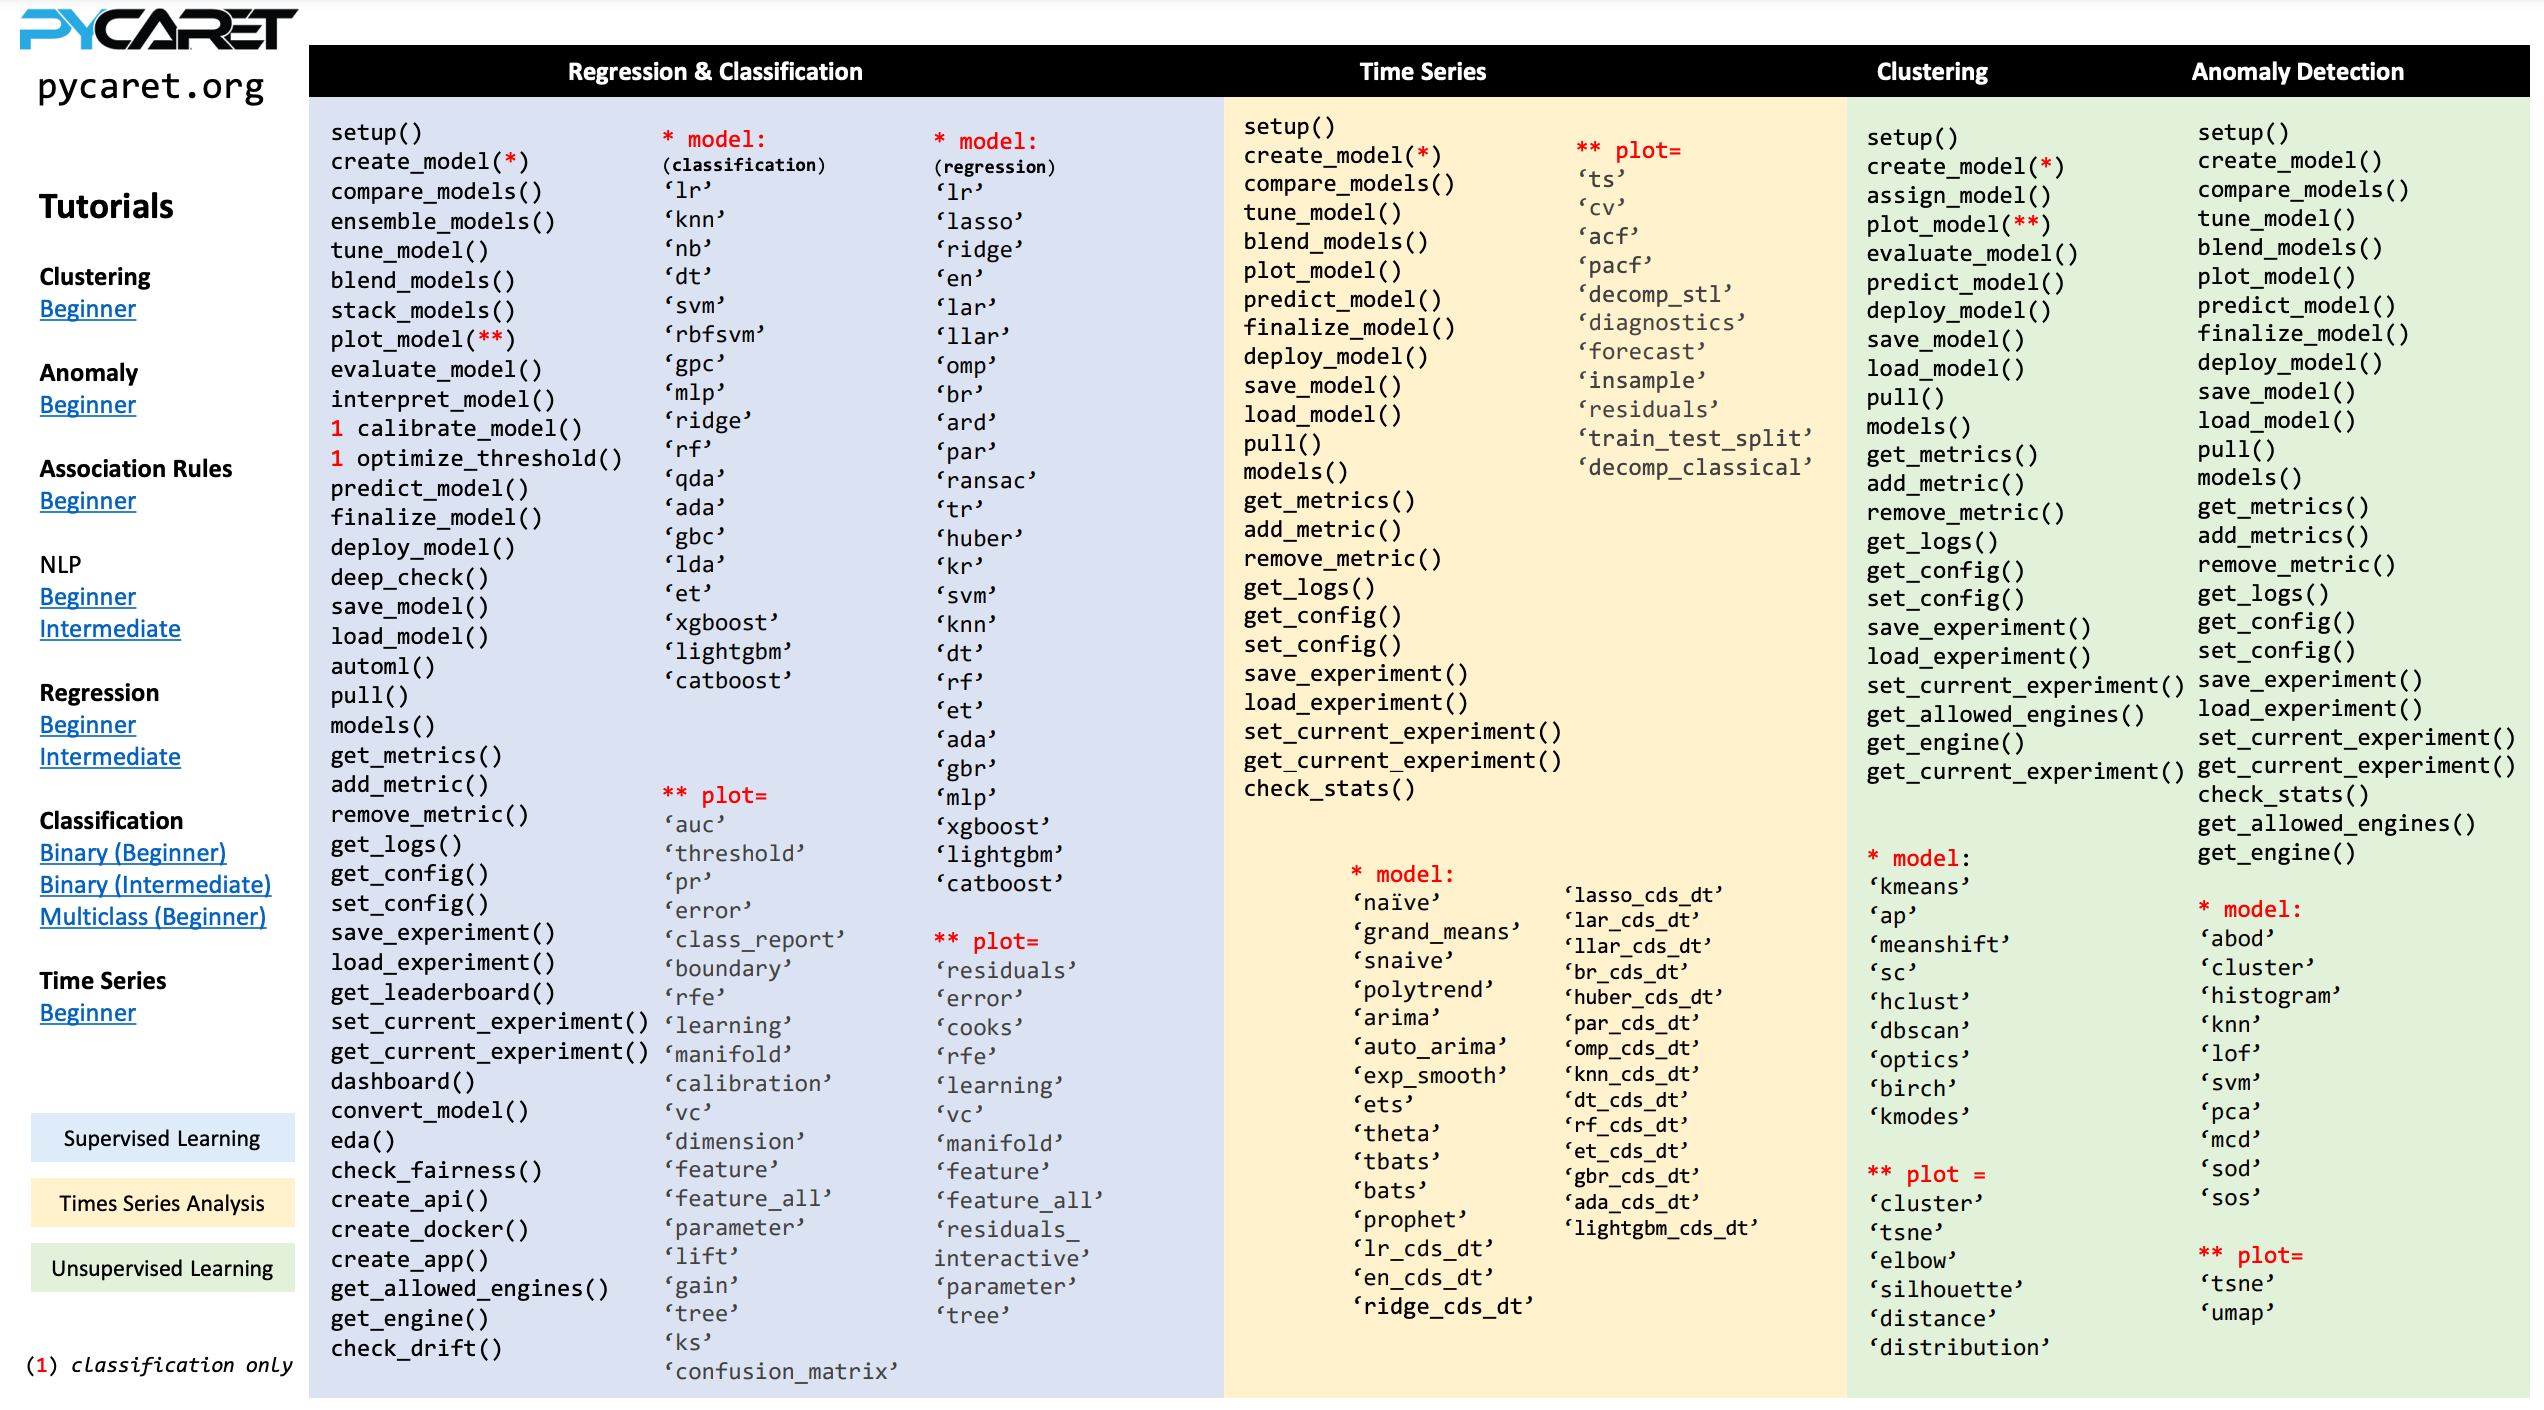
## 8. 低代码机器学习——PyCaret
- **GitHub**: https://github.com/pycaret/pycaret
- 官网:https://www.pycaret.org/
- **功能**: 低代码机器学习库
- **特点**: 自动化机器学习工作流程
- **优势**: 降低机器学习项目的开发难度
- **安装**: `pip install pycaret`
- **代码示例**:
```python
from pycaret.classification import *
# 设置实验
exp = setup(data, target='target_column')
# 比较所有模型
best_model = compare_models()
# 创建模型
model = create_model('rf') # 随机森林
# 调优模型
tuned_model = tune_model(model)
# 预测
predictions = predict_model(best_model, data=test_data)
# 保存模型
save_model(model, 'model_name')
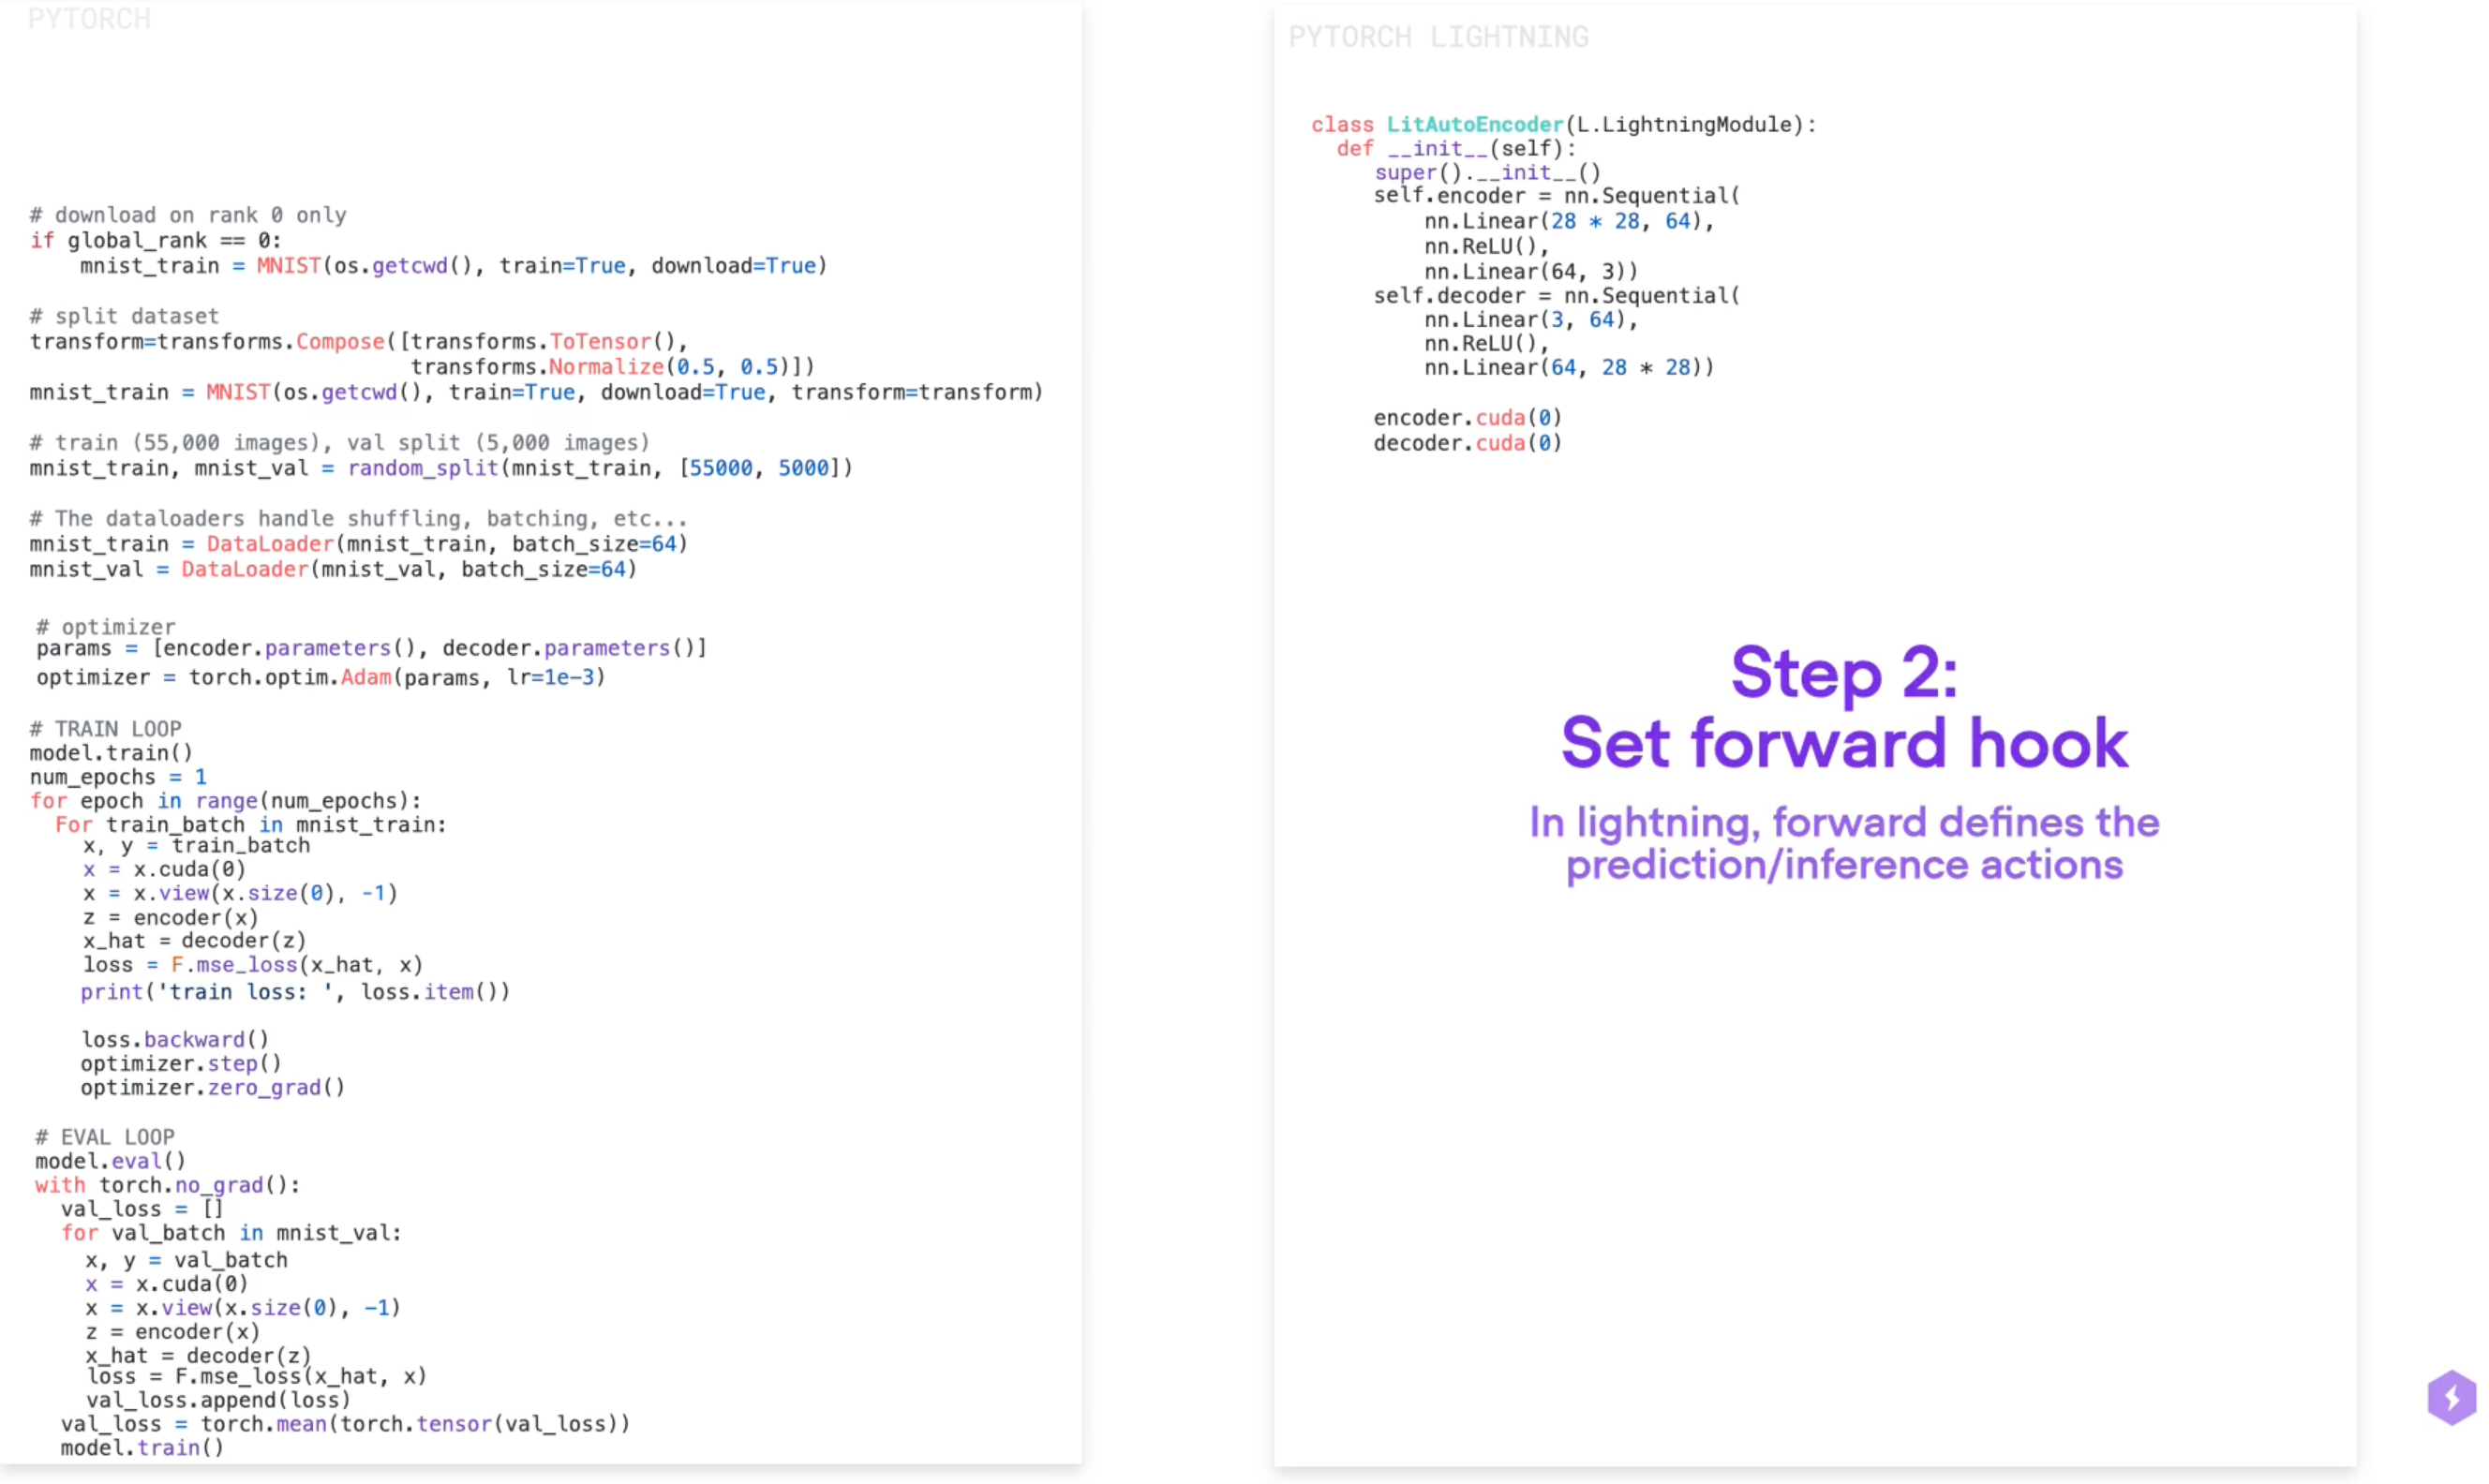
9. 深度学习框架——PyTorch-Lightning
- 文档: https://lightning.ai/docs/pytorch/stable/
- 功能: PyTorch的高级封装
- 特点: 简化模型训练流程,减少样板代码
- 优势: 让研究人员更专注于创新而不是编写基础代码
- 安装:
pip install pytorch-lightning - 代码示例: ```python import pytorch_lightning as pl import torch.nn.functional as F
class MyModel(pl.LightningModule): def init(self): super().init() self.layer = nn.Linear(28*28, 10)
1
2
3
4
5
6
7
8
9
def training_step(self, batch, batch_idx):
    x, y = batch
    y_hat = self(x)
    loss = F.cross_entropy(y_hat, y)
    self.log('train_loss', loss)
    return loss

def configure_optimizers(self):
    return torch.optim.Adam(self.parameters(), lr=0.001)
训练模型
trainer = pl.Trainer(max_epochs=10, gpus=1) trainer.fit(model, train_loader, val_loader)
1
2
3
4
5
6
7
8
9
10
11
12
13
14
15
16
17
18
19
20
21
22
23
24
25
26
27
28
29
30
31
32
33
34
35
36
37
38
39
40
41
42
43
44
45
46
47
48
49
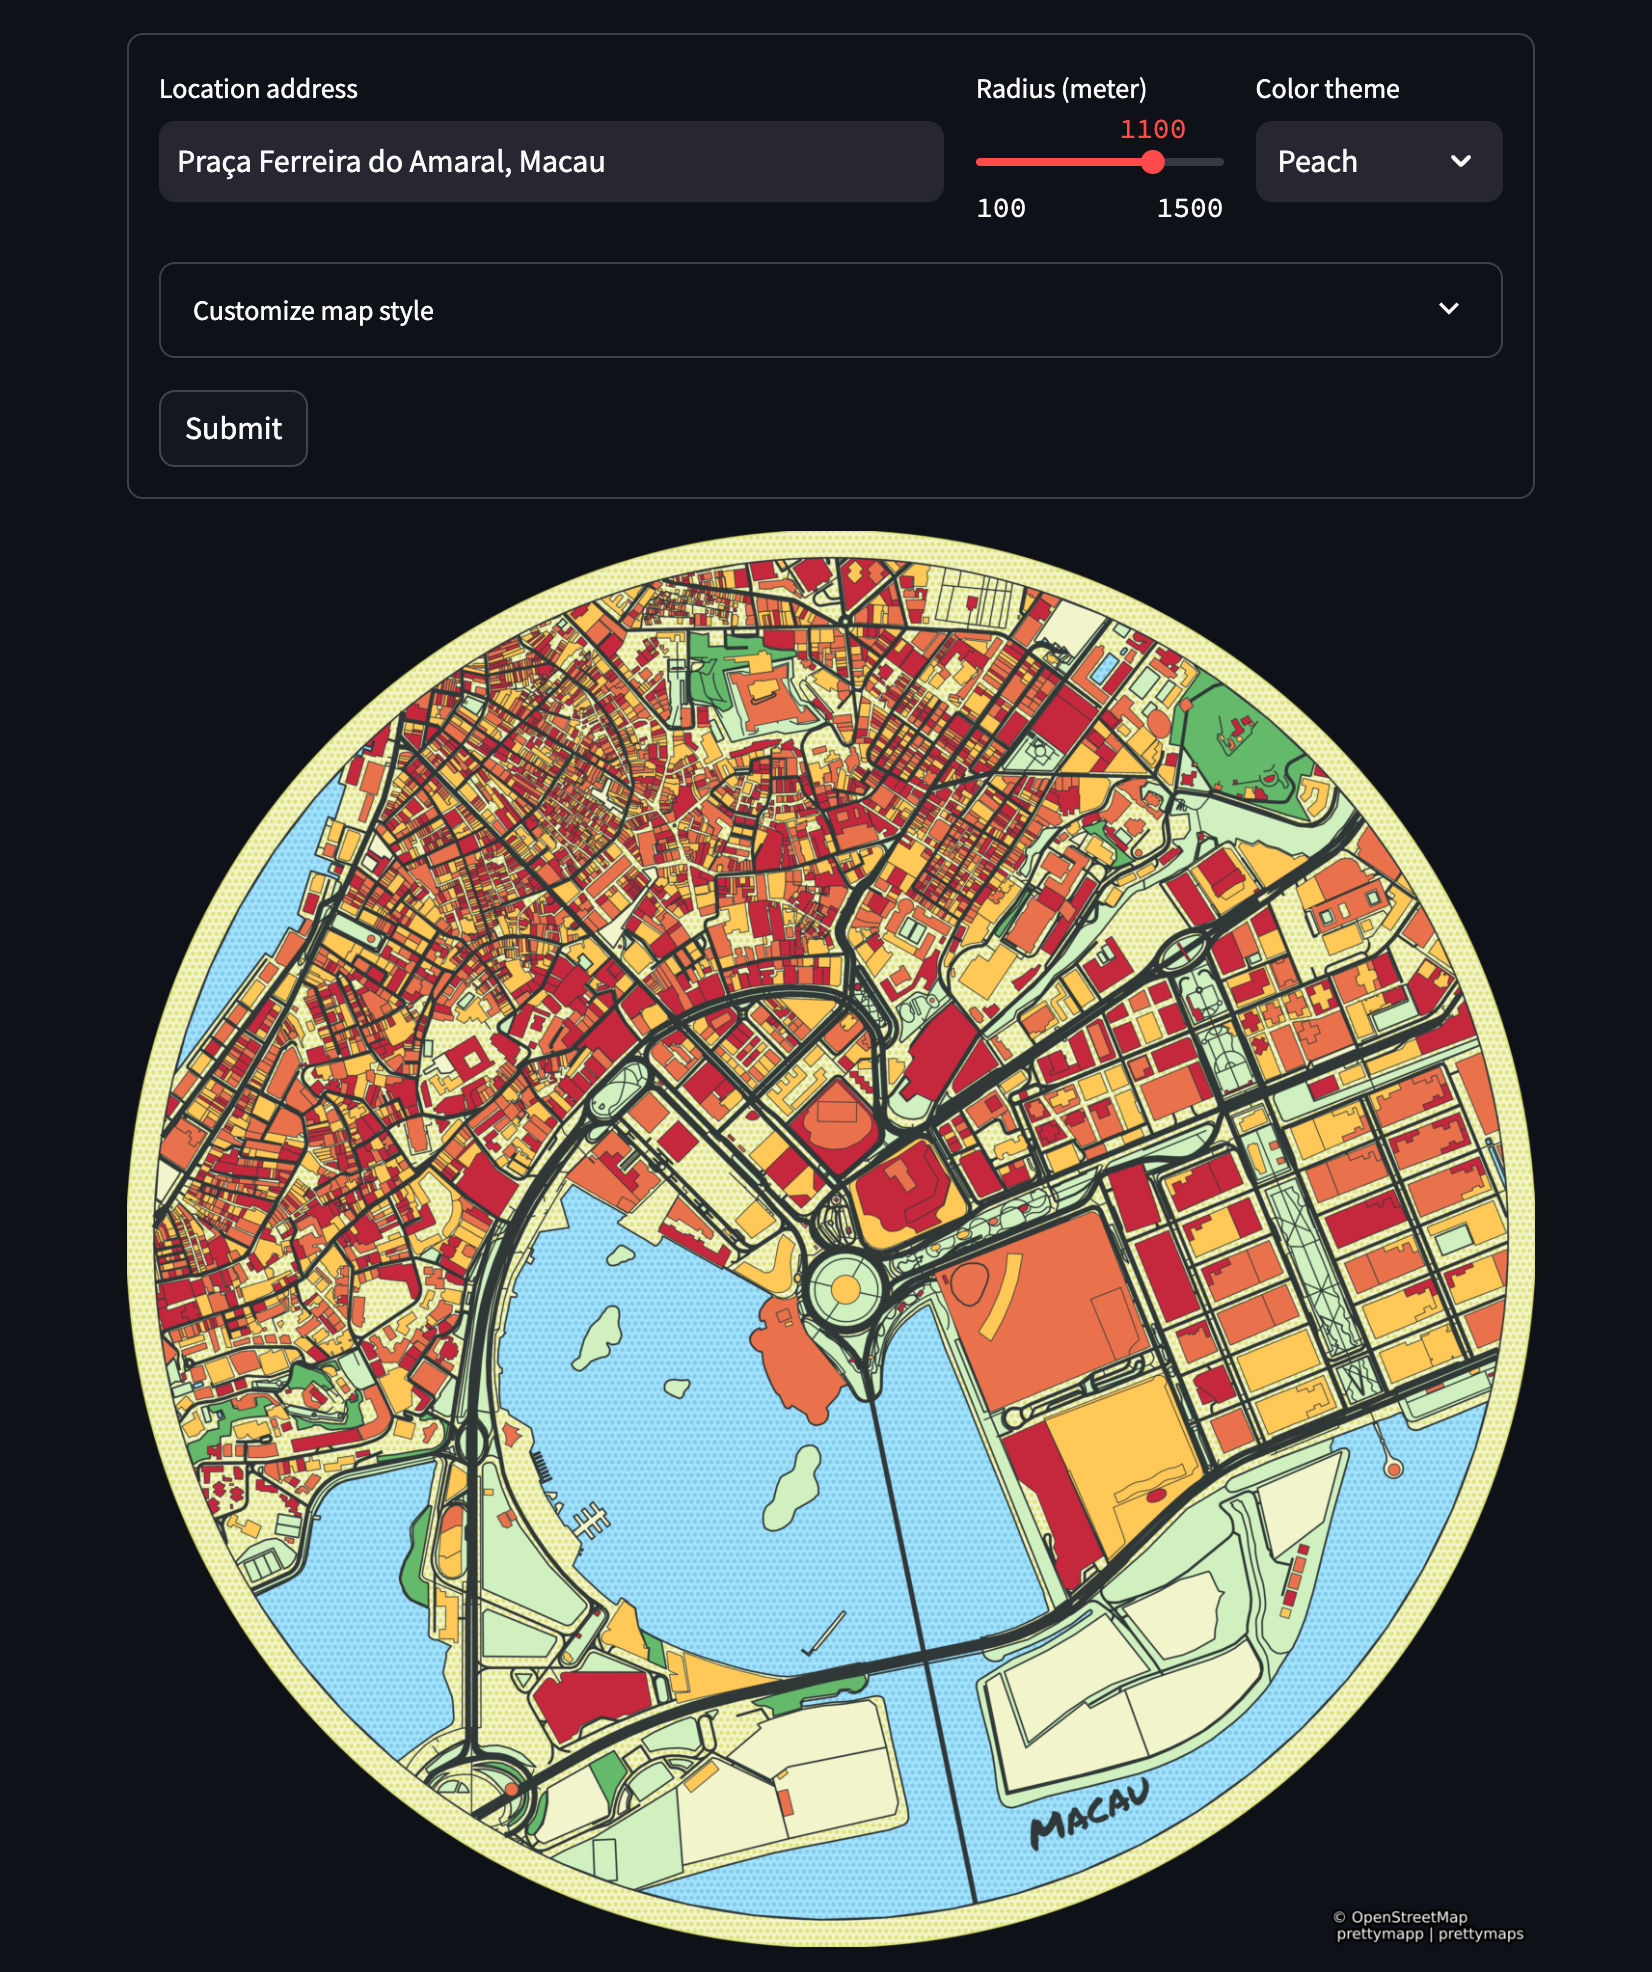
## 10. Web应用开发——Streamlit
- **官网**: https://streamlit.io
- **功能**: 创建数据科学web应用
- **特点**: 简单易用的界面创建工具
- **优势**: 快速部署机器学习模型和数据可视化
- **安装**: `pip install streamlit`
- **代码示例**:
```python
import streamlit as st
import pandas as pd
import plotly.express as px
st.title("数据分析仪表板")
# 侧边栏配置
with st.sidebar:
st.header("配置")
option = st.selectbox("选择图表类型", ["散点图", "折线图", "柱状图"])
# 文件上传
uploaded_file = st.file_uploader("选择CSV文件")
if uploaded_file:
df = pd.read_csv(uploaded_file)
st.dataframe(df)
# 数据统计
st.write("数据统计摘要")
st.write(df.describe())
# 创建可视化
if option == "散点图":
fig = px.scatter(df, x='column1', y='column2')
elif option == "折线图":
fig = px.line(df, x='column1', y='column2')
else:
fig = px.bar(df, x='column1', y='column2')
st.plotly_chart(fig)
# 下载处理后的数据
st.download_button(
label="下载处理后的数据",
data=df.to_csv(index=False),
file_name='processed_data.csv',
mime='text/csv'
)
使用建议
- 入门阶段:
- 从PyCaret和Streamlit开始
- 使用LazyPredict快速了解不同模型效果
- 利用Lux进行初步数据探索
- 通过Drawdata加深对算法的理解
- 进阶阶段:
- 使用CleanLab提高数据质量
- 用PyTorch-Lightning优化深度学习工作流
- 探索Lux进行高级数据可视化
- 使用Black维护代码质量
- 深入研究各工具的高级特性
- 团队协作:
- 使用Black保持代码风格一致
- 用Streamlit展示项目成果
- 采用PivotTableJS进行团队数据分析
- 使用PyForest简化环境管理
- 建立统一的代码规范和工作流程
- 项目部署:
- Streamlit用于快速部署原型
- PyTorch-Lightning用于模型生产部署
- PyCaret用于快速实验和模型选择
- 注意性能优化和扩展性考虑
最佳实践
- 工具组合
- 数据预处理:CleanLab + PyCaret
- 模型开发:PyTorch-Lightning + LazyPredict
- 可视化展示:Streamlit + Lux
- 代码质量:Black + PyForest
- 开发流程
- 数据探索阶段:Lux + PivotTableJS
- 模型实验阶段:LazyPredict + PyCaret
- 产品化阶段:PyTorch-Lightning + Streamlit
- 维护阶段:Black + 自动化测试
- 技能提升
- 循序渐进学习各工具
- 关注工具更新和新特性
- 参与社区讨论和贡献
这些Python工具的组合使用不仅能提高个人工作效率,还能促进团队协作和项目质量。随着数据科学领域的快速发展,这些工具也在不断进化,建议持续关注它们的更新和新功能,以便更好地应用到实际工作中。选择合适的工具组合,建立高效的工作流程,将极大地提升数据科学项目的开发效率和质量。