简介
大家好,我是章北海
推荐一个开源的科研图表可视化神器——pylustrator

简单来说,Pylustrator 提供了一个 UI 来调整 Matplotlib 图表,使对可视化进行最终调整变得更加容易。
你可以随意用鼠标调整Matplotlib图表中的布局、尺寸、文本、注释等内容,交互式地对图形进行组合。
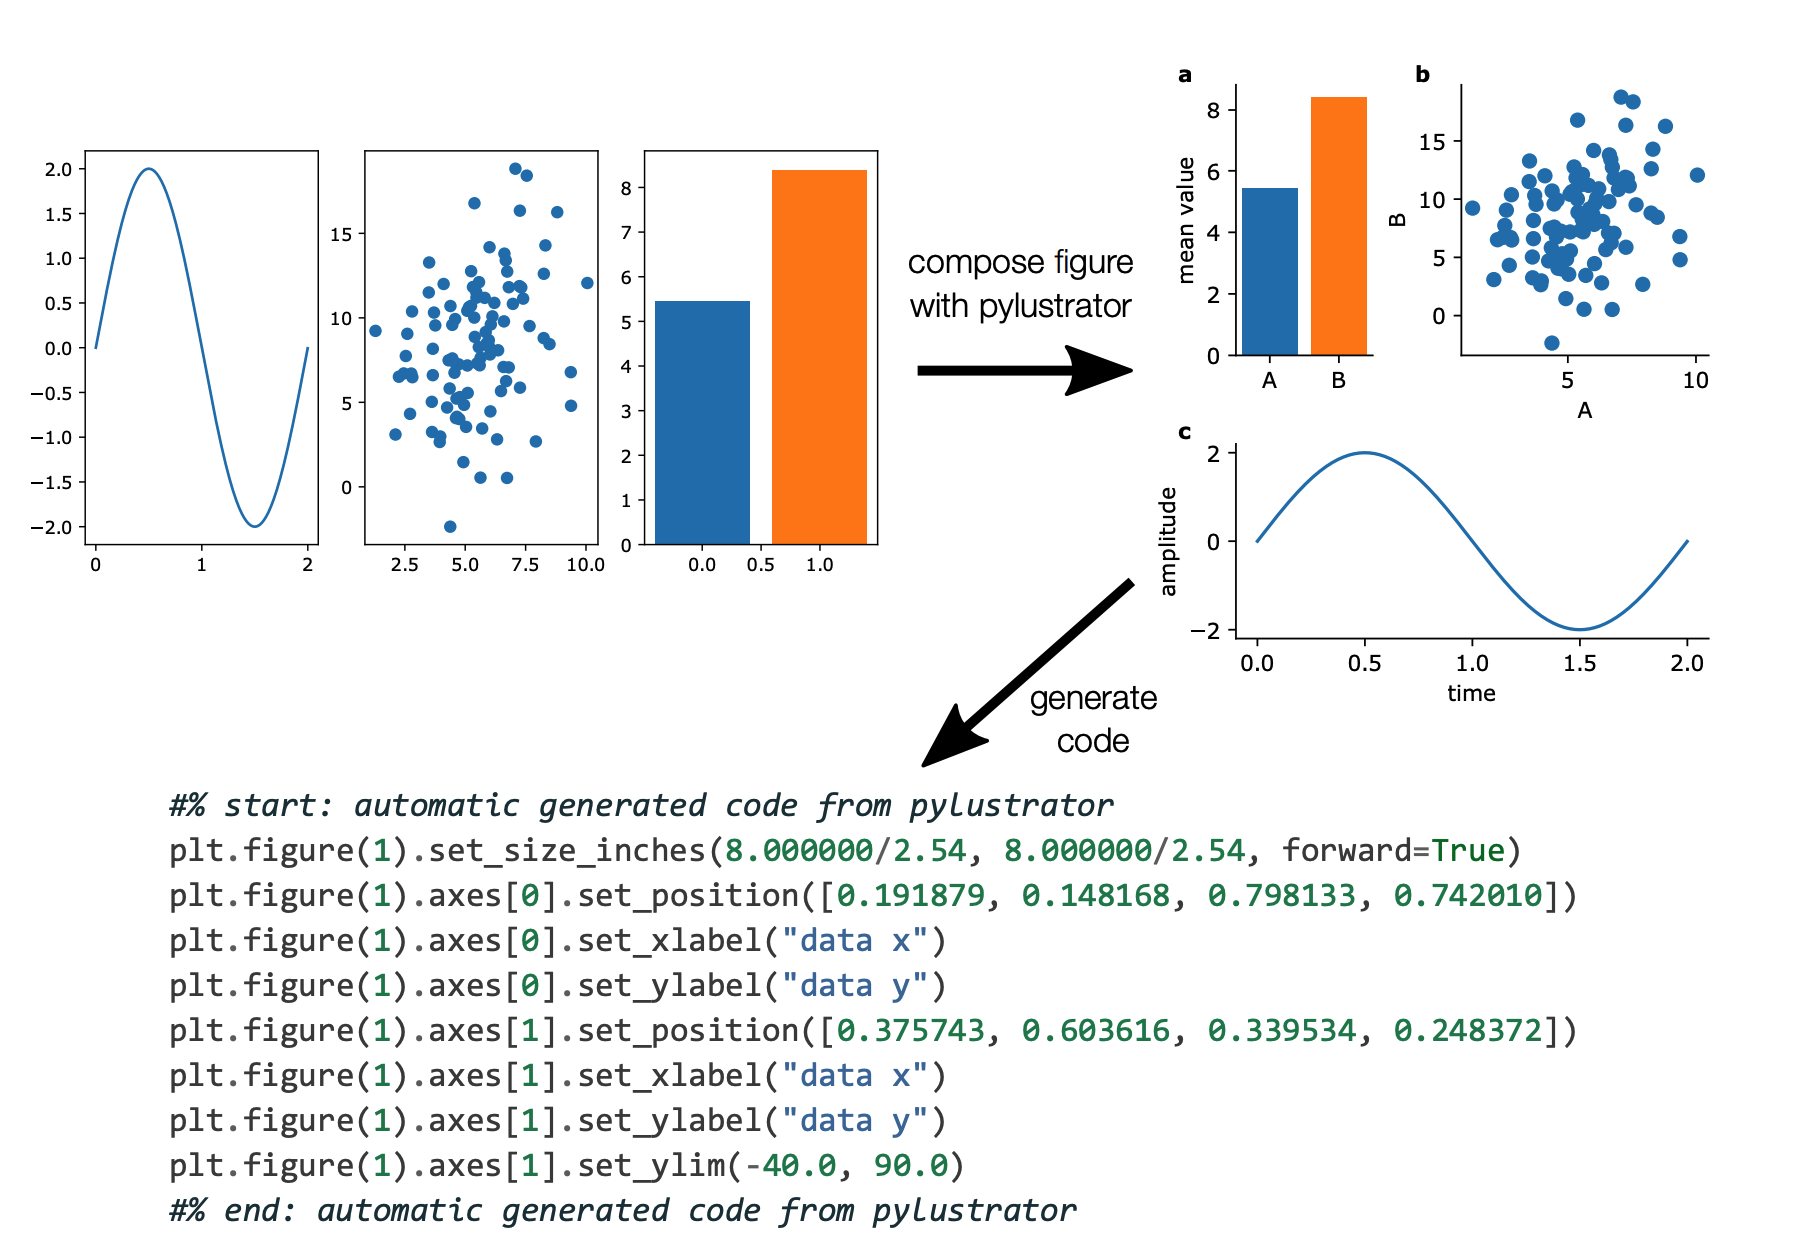
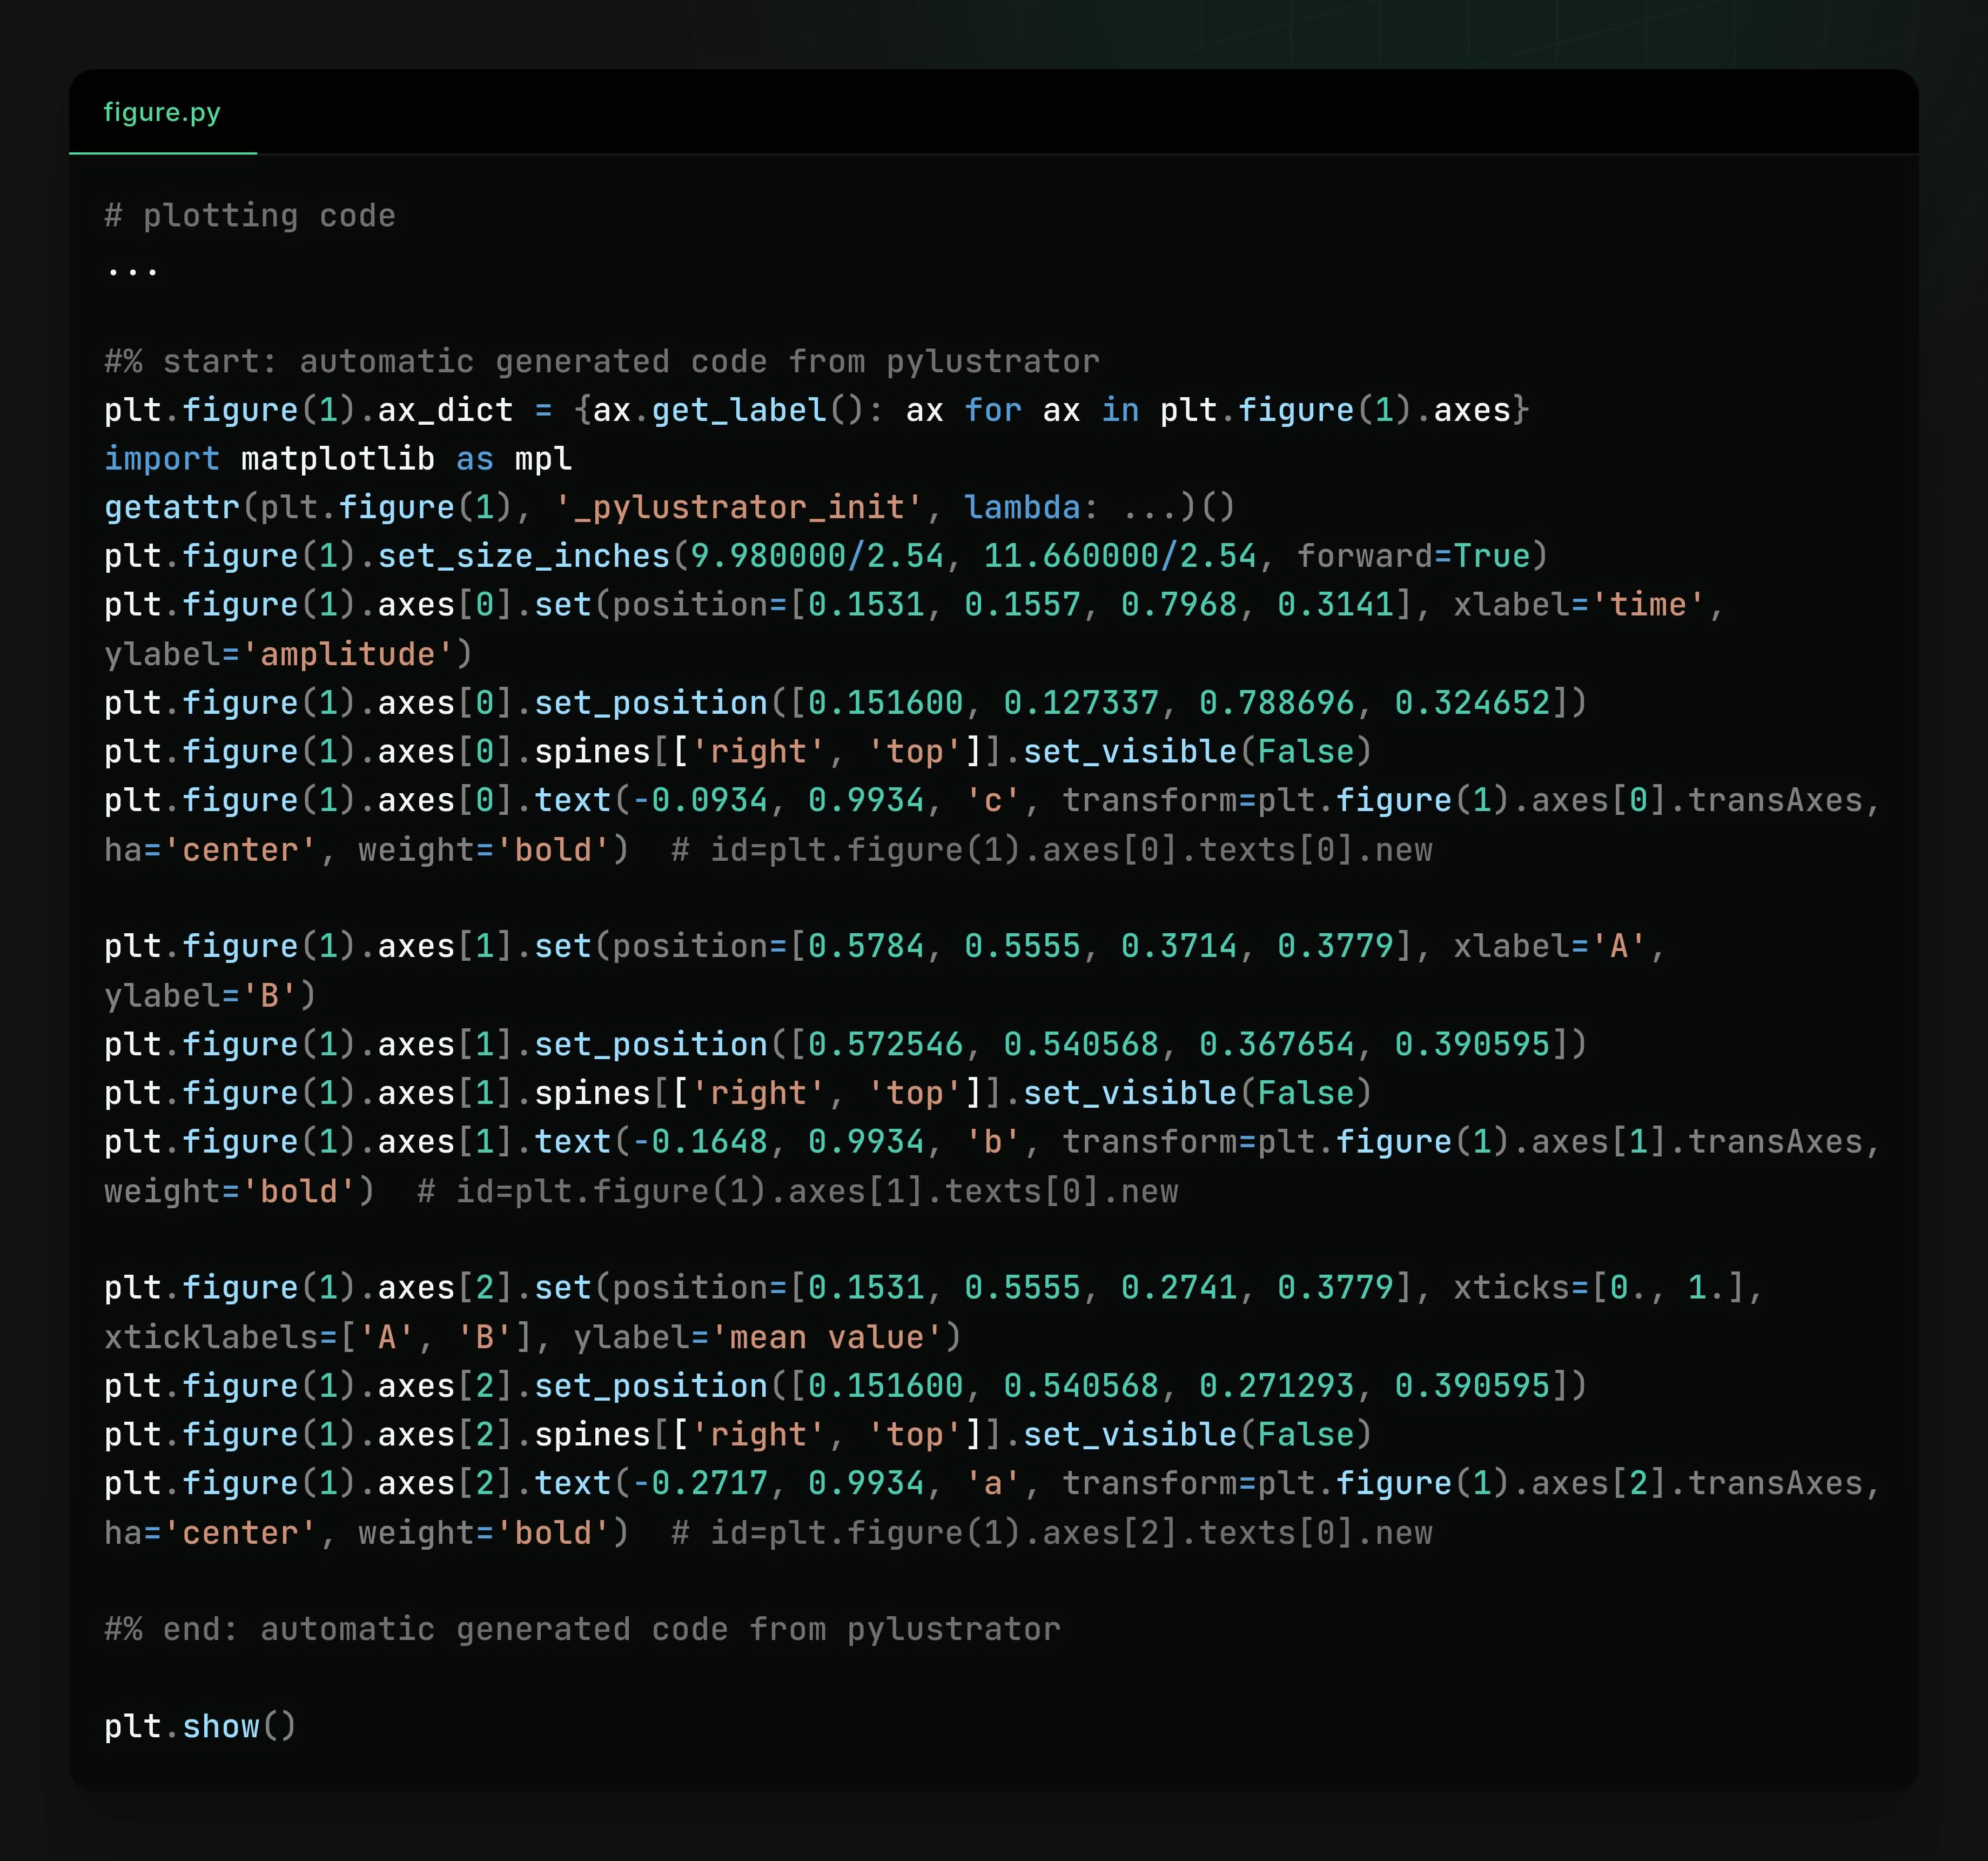
所有更改都被跟踪并转换为代码,该代码会自动集成到调用脚本文件中。
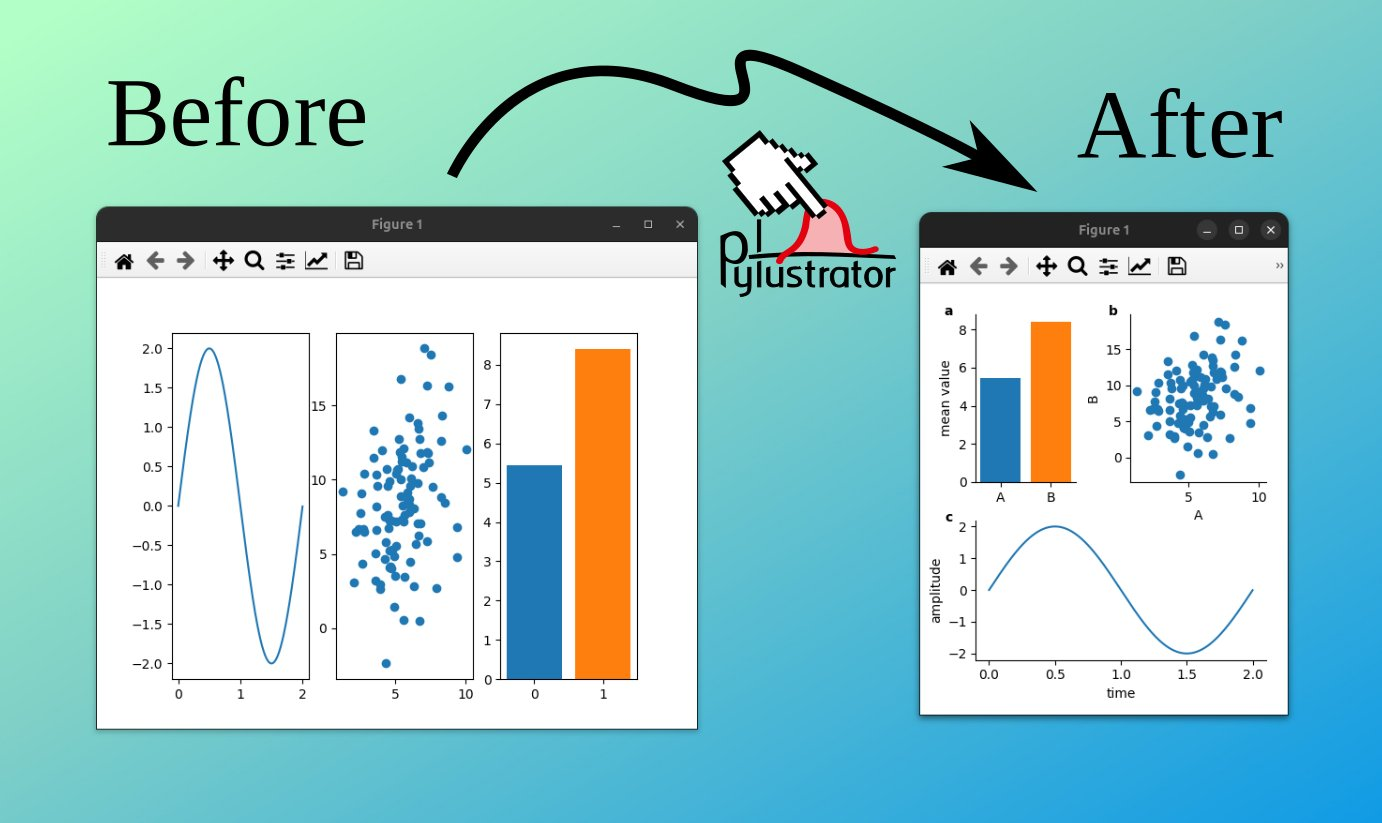
比如下图zhong中,将左图三个图表布局改成右侧,只需要动动鼠标就行了,代码是自动生成的!
安装
很简单: pip install pylustrator 即可
依赖有点多,可能有点慢。
使用
官网有个例子,其实就是正常的编写代码
中间引入pylustrator即可,然后激活pylustrator.start()。
1
2
3
4
5
6
7
8
9
10
11
12
13
14
15
16
17
18
19
20
21
22
23
24
25
26
27
28
29
30
# import matplotlib and numpy as usual
import matplotlib.pyplot as plt
import numpy as np

# now import pylustrator
import pylustrator

# activate pylustrator
pylustrator.start()

# build plots as you normally would
np.random.seed(1)
t = np.arange(0.0, 2, 0.001)
y = 2 * np.sin(np.pi * t)
a, b = np.random.normal(loc=(5., 3.), scale=(2., 4.), size=(100,2)).T
b += a

plt.figure(1)
plt.subplot(131)
plt.plot(t, y)

plt.subplot(132)
plt.plot(a, b, "o")

plt.subplot(133)
plt.bar(0, np.mean(a))
plt.bar(1, np.mean(b))

# show the plot in a pylustrator window
plt.show()
然后就会弹出一个交互式页面,图表中的所有元素都可以通过鼠标调整。
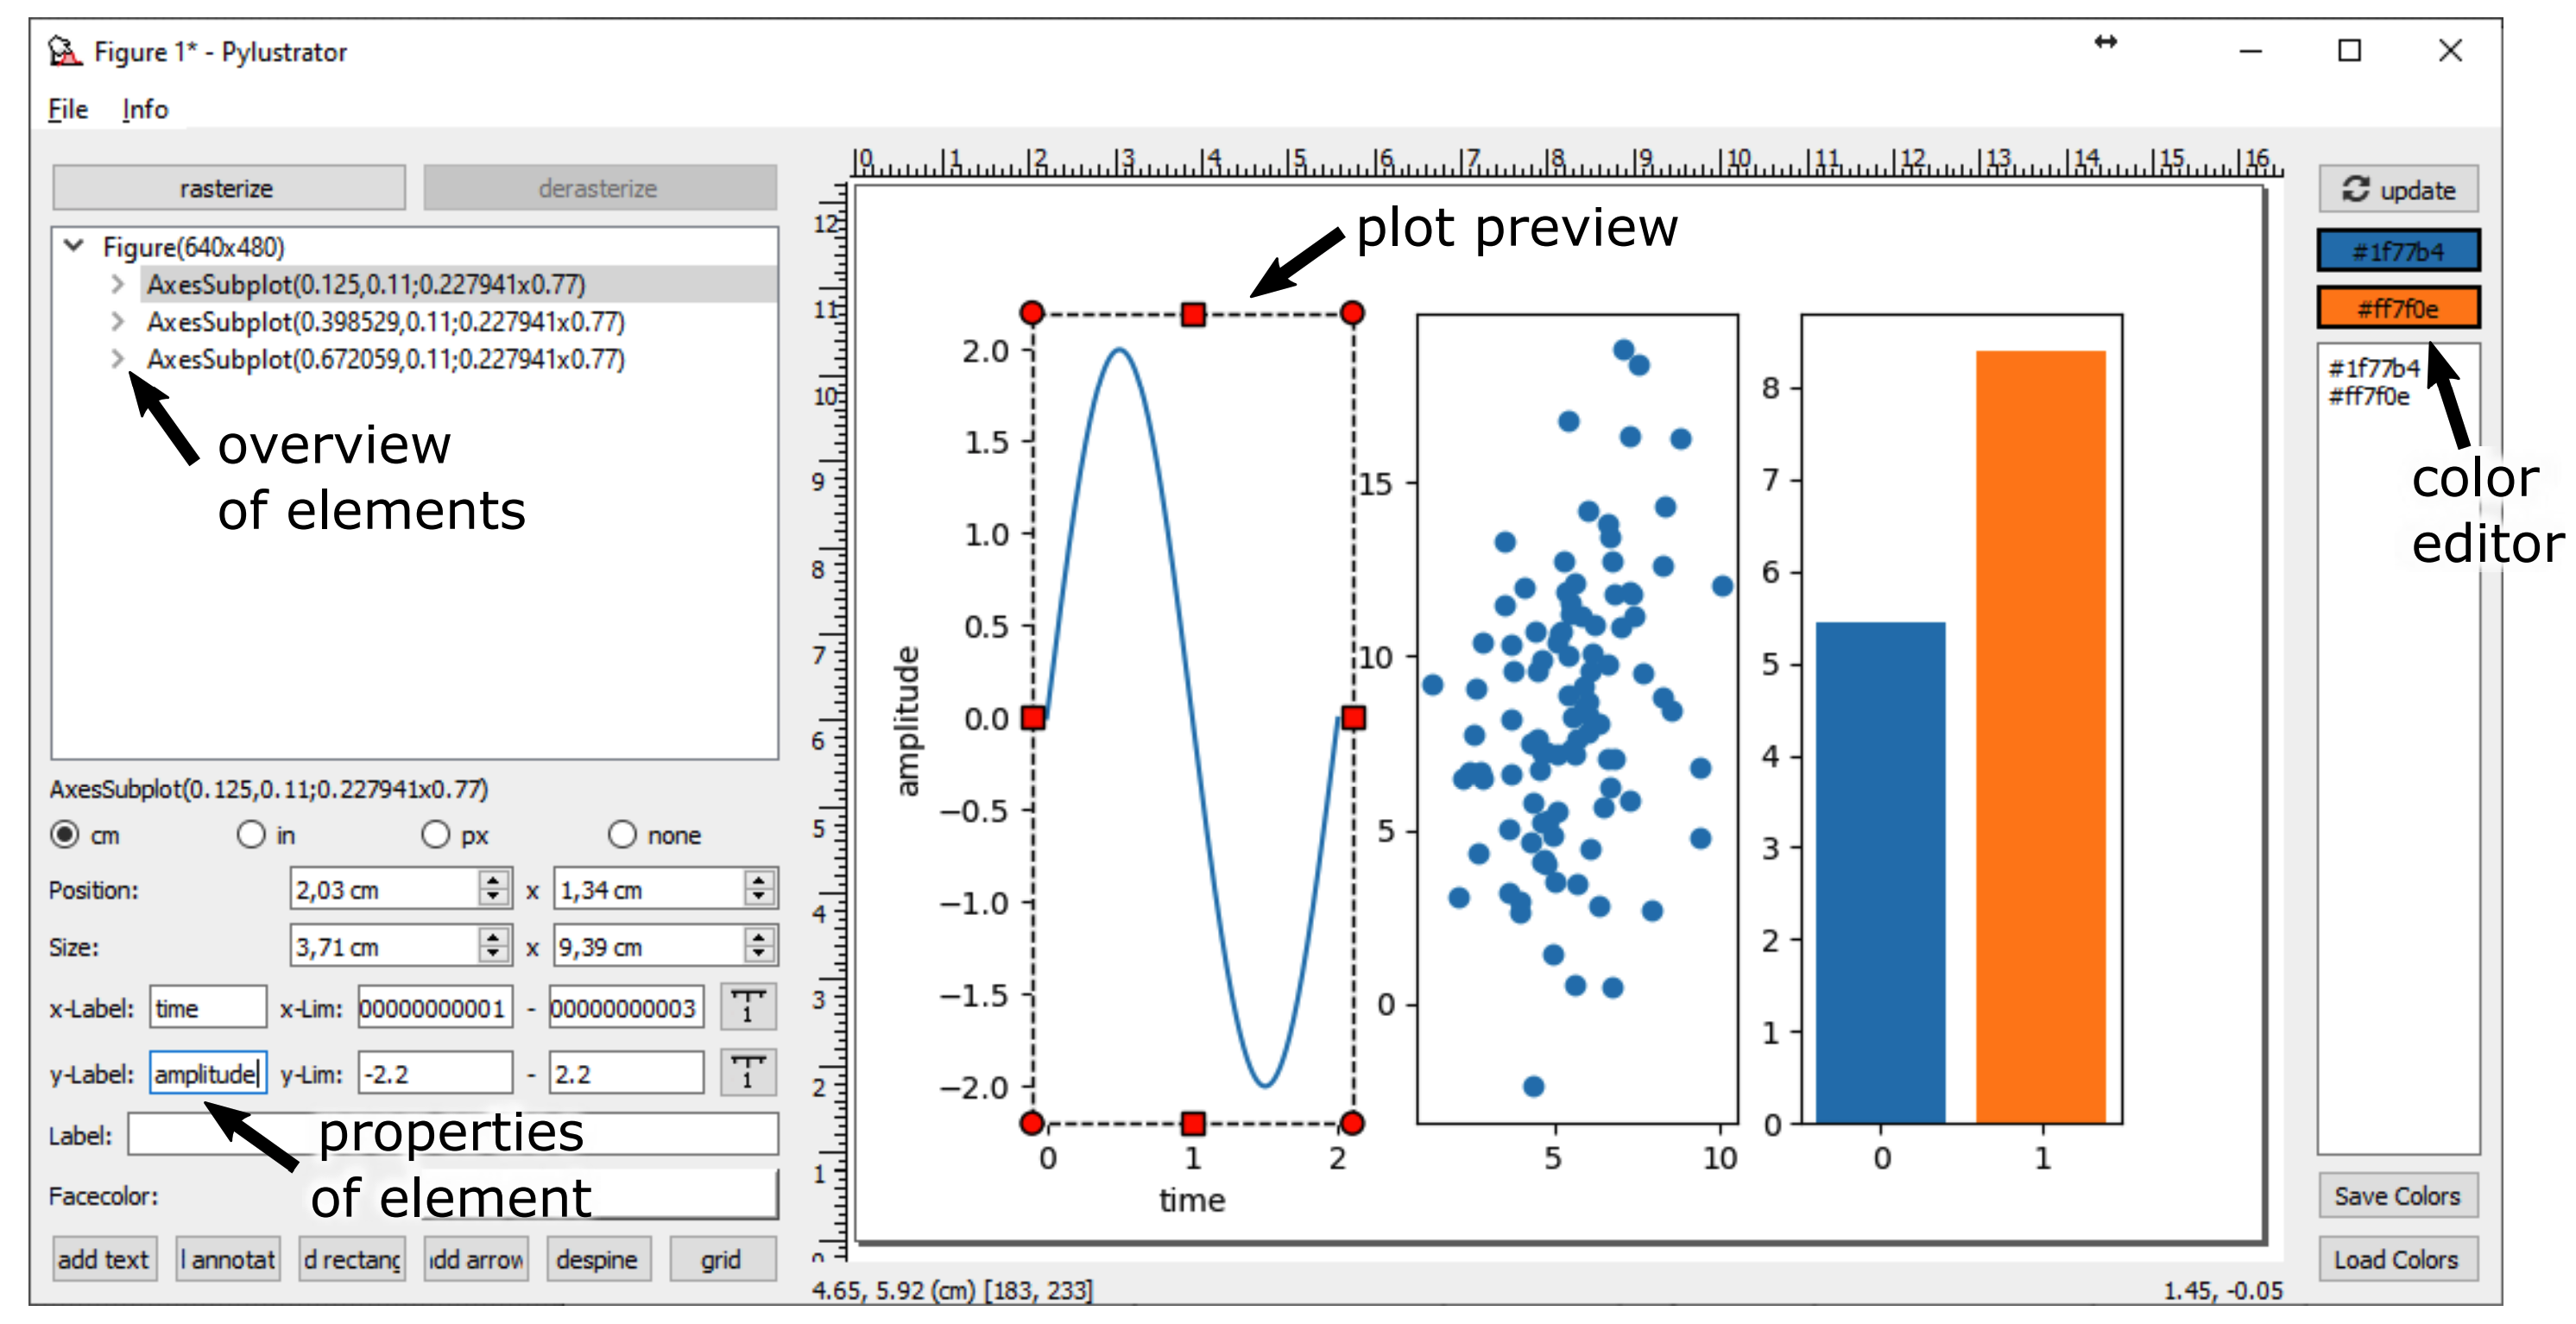
每次操作,它还会把操作保存为 Python 代码!💾
所有更改完全可重复,可以轻松地共享或在工作流程中重用。
感兴趣可以试试:
论文:https://arxiv.org/pdf/1910.00279
项目:https://github.com/rgerum/pylustrator